Back to projects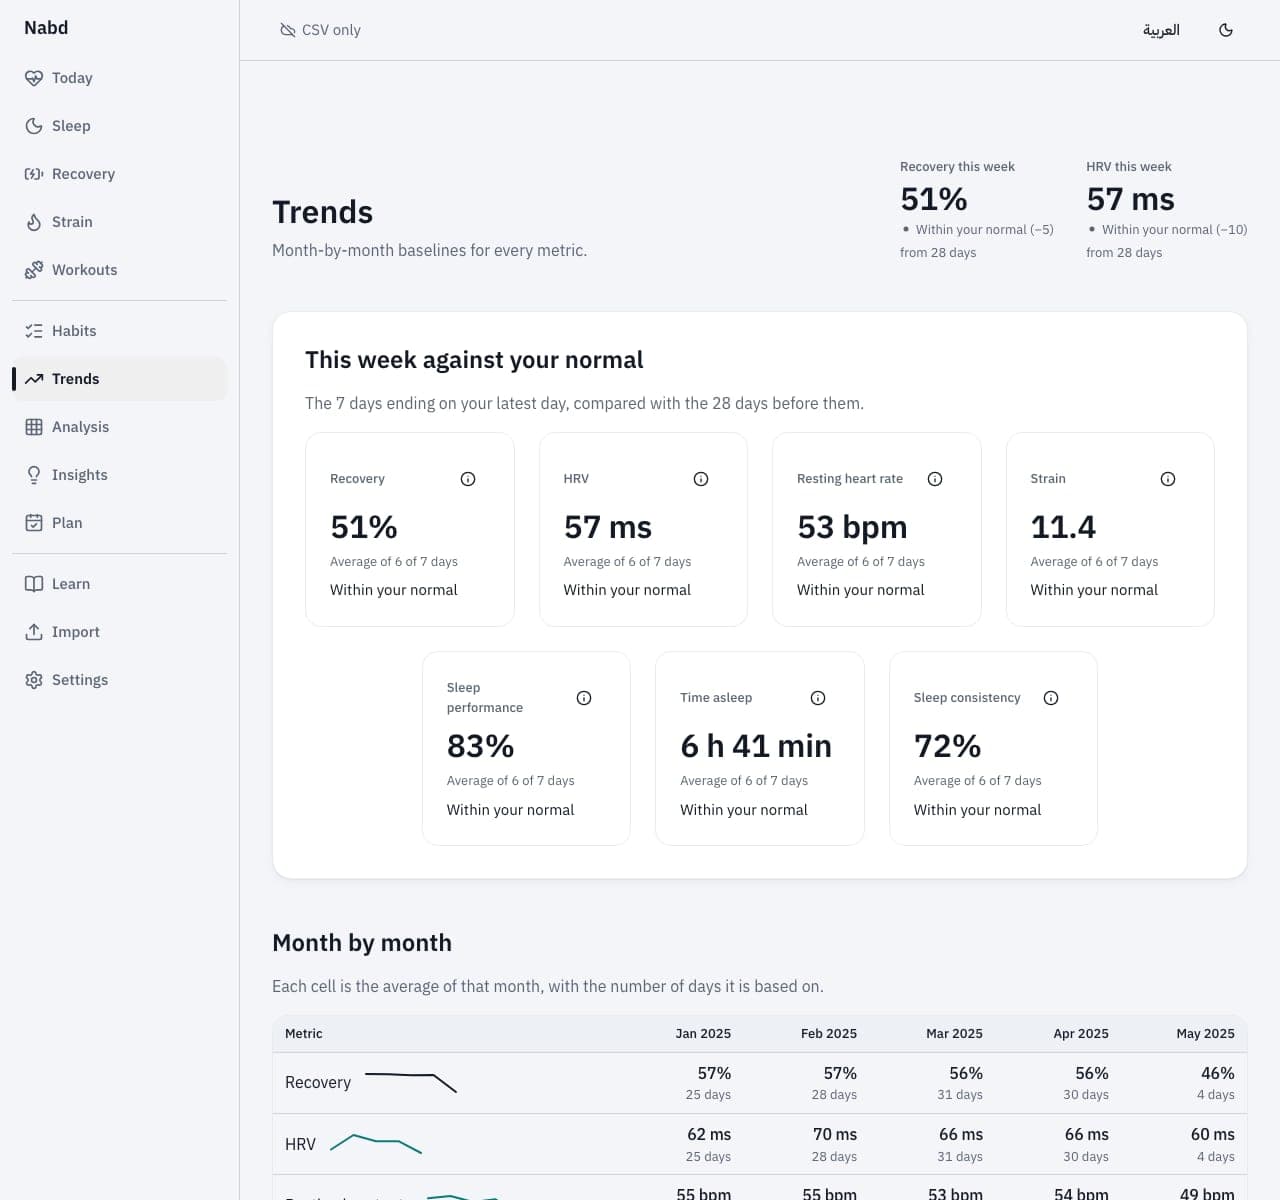
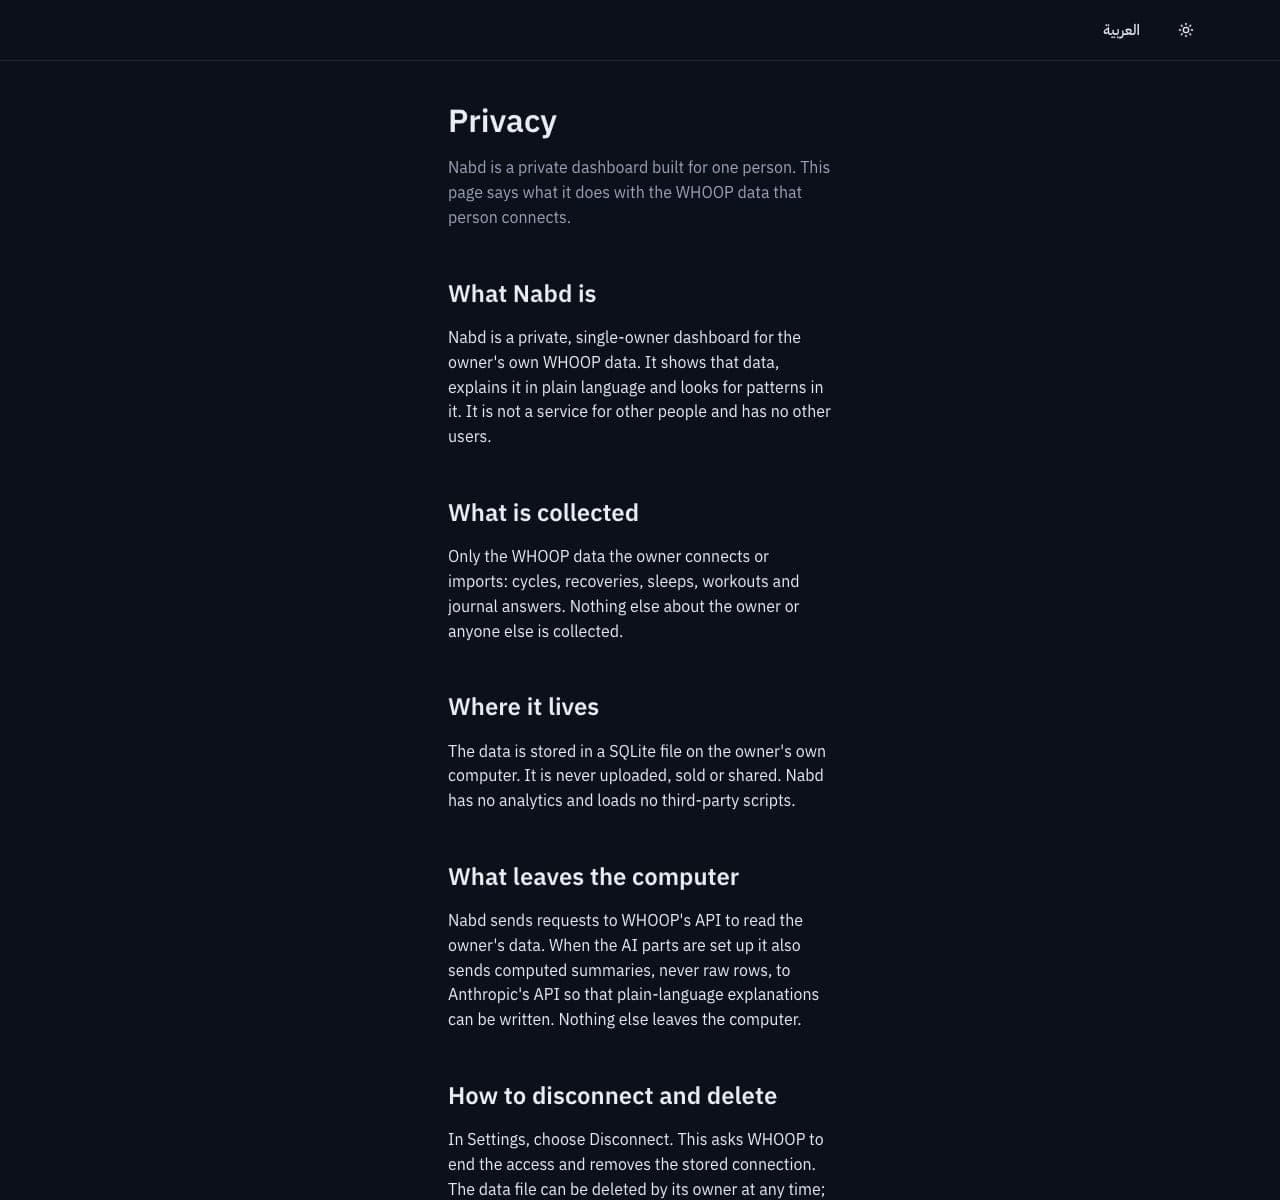
Nabd (نبض)
A private bilingual dashboard that explains one person’s WHOOP data, finds their own baselines, and keeps every health row on their machine.
- Year
- 2026
- Type
- Web app
- Status
- Private
Private build — shown as a case study, not a public product.
The problem. A WHOOP band produces months of recovery, sleep and strain numbers, and reading them well takes context. I wanted a private dashboard, in Arabic and English, that explains the data in plain language, finds the wearer's own normal ranges and correlations, and turns them into a two-week plan, without raw health rows ever leaving the owner's machine.
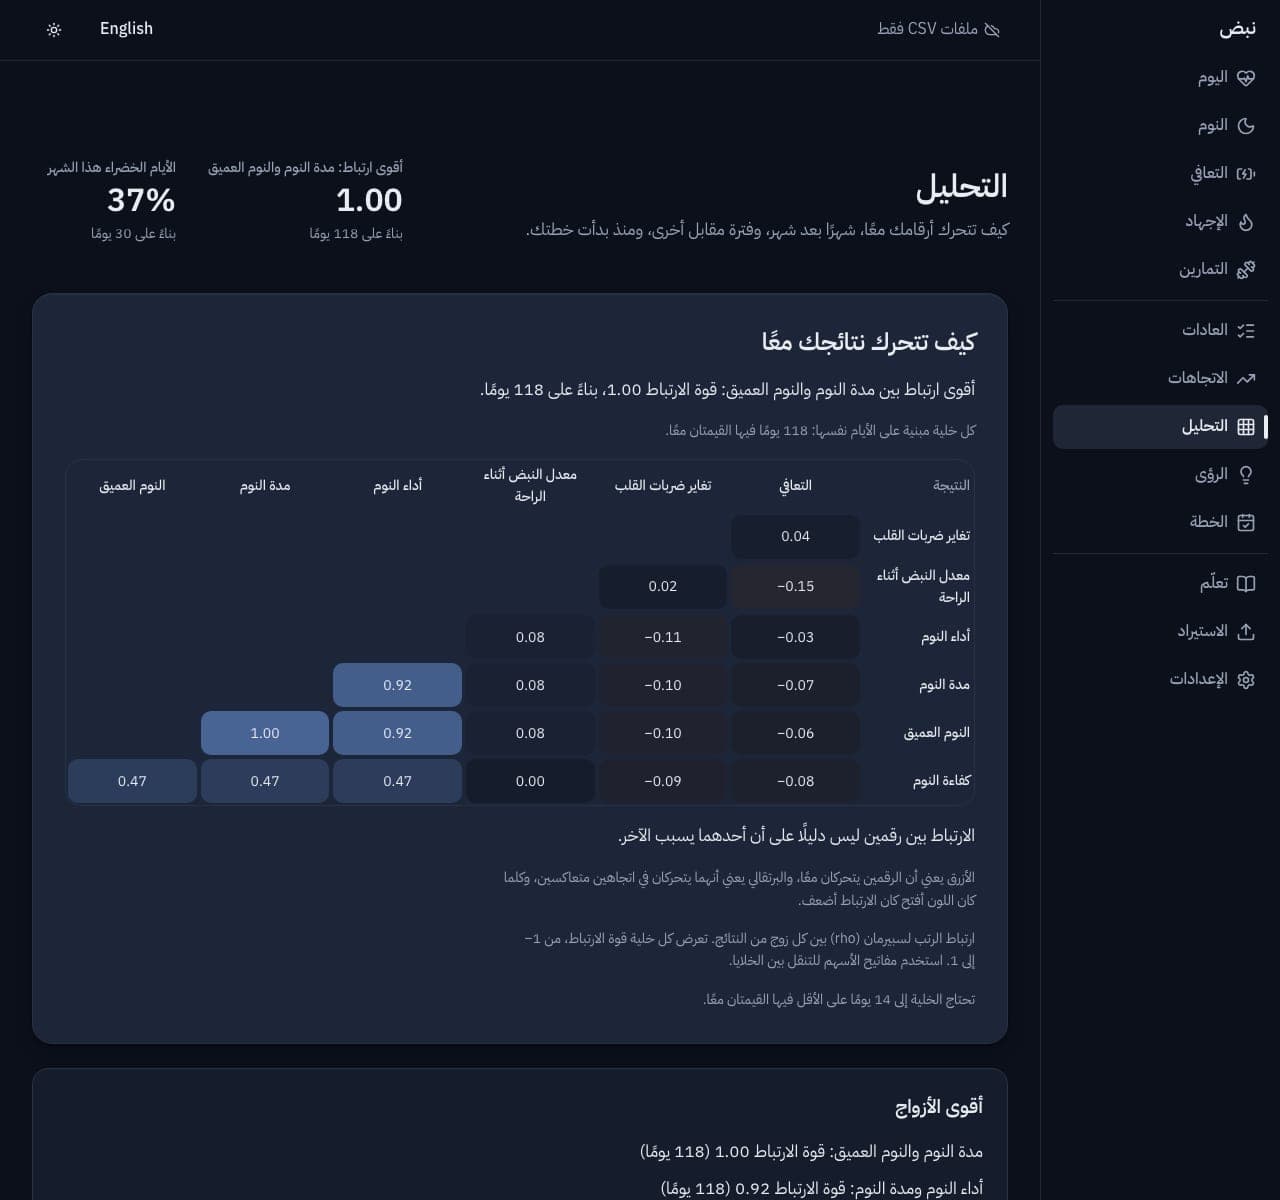
The hard part. Plain-language explanations usually mean sending raw data to a model. Nabd only ever sends computed summaries, never rows: a privacy guard is the last check before any request leaves the machine, a "Show what is sent" control displays the exact payload, and a monthly token budget caps spend. The analytics also refuse to present a correlation as a cause, which shaped both the maths and the copy.
The approach. Four one-way layers run from ingestion to analytics to API to app. The analytics package is pure TypeScript with no I/O and is the only place a number is computed. Two ingestion paths, the WHOOP CSV export and the WHOOP API on a scheduled sync, write through one upsert. The app is Nuxt 4 on SQLite via libSQL and Drizzle, styled with Tailwind logical properties and self-hosted IBM Plex Sans Arabic.
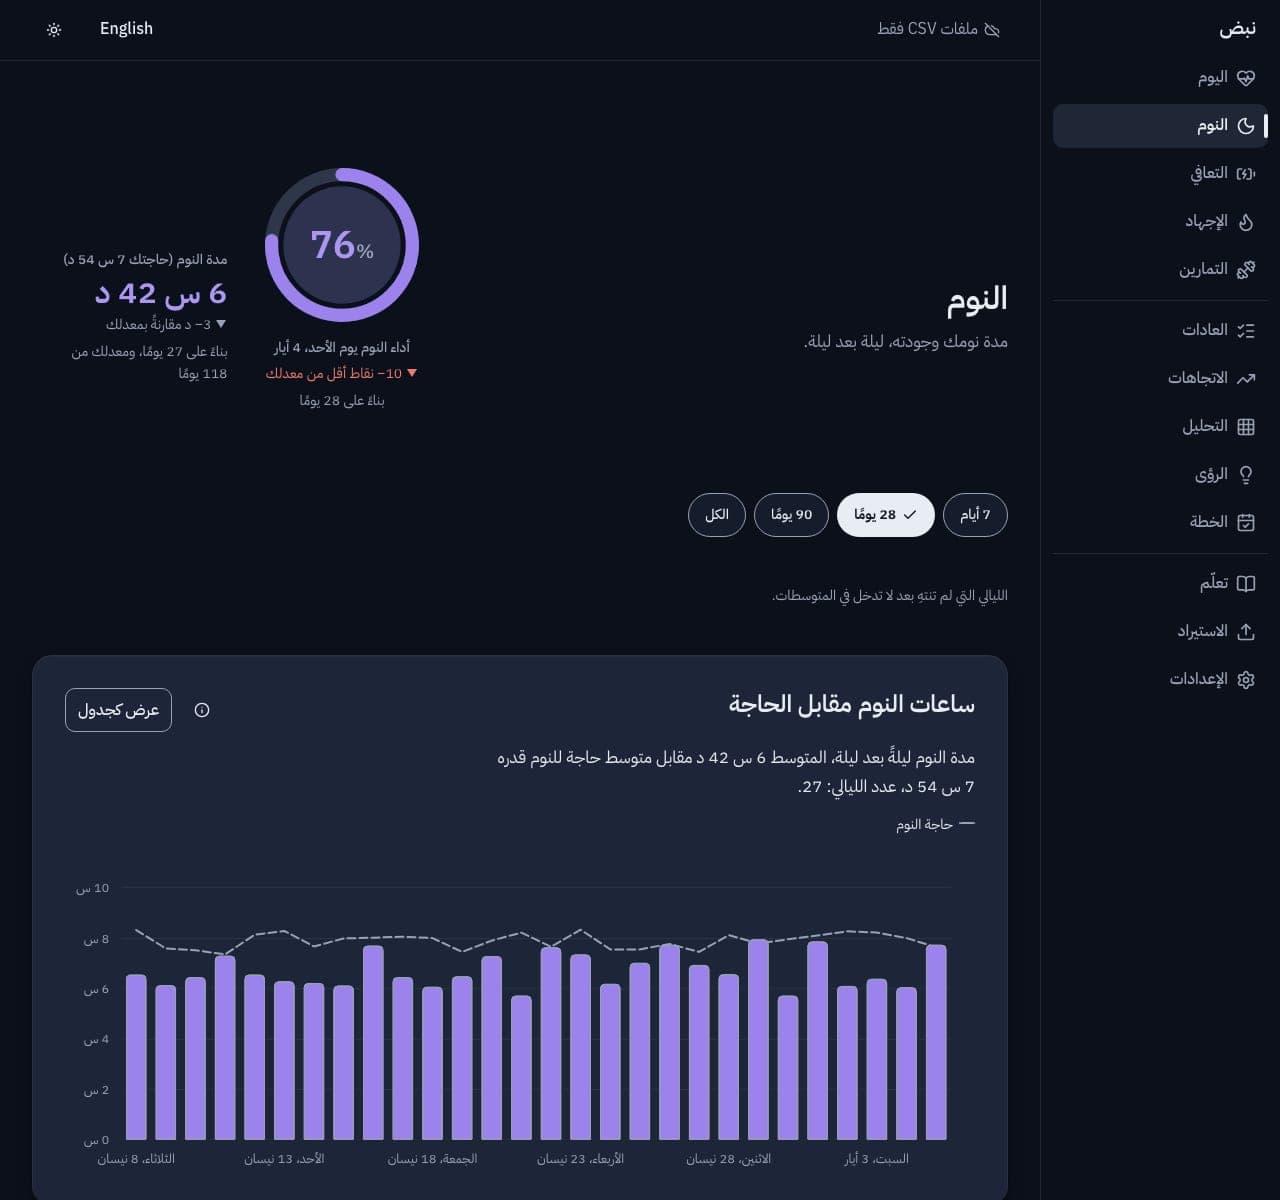
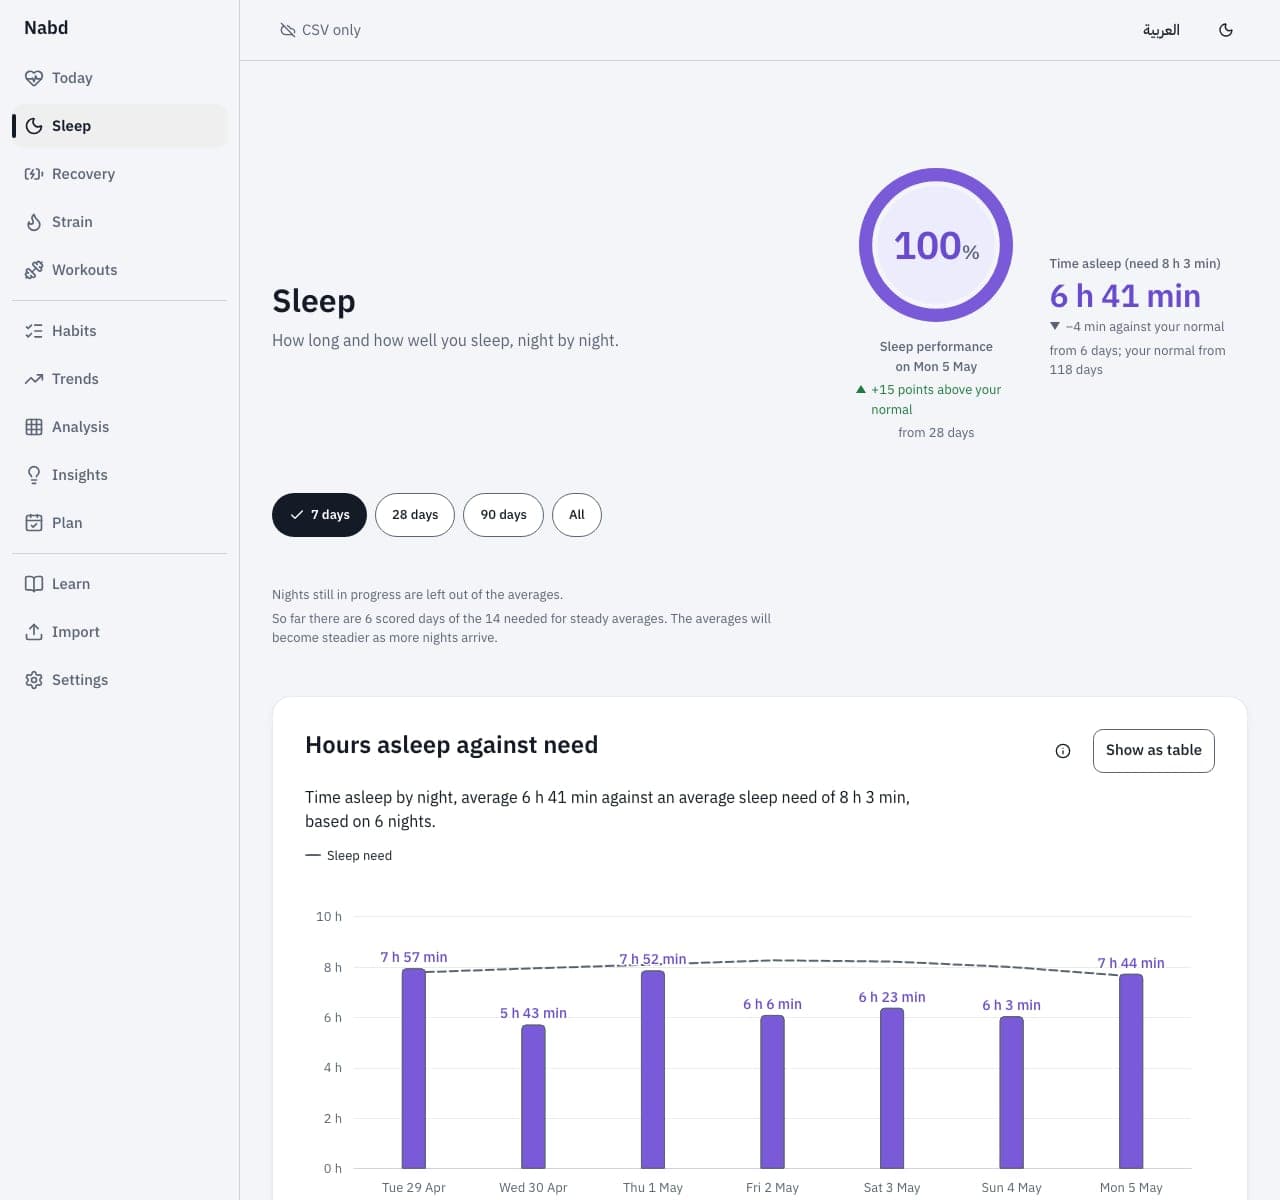
The outcome. Nabd was built in phases, each closed by a written gate, with a decision log of more than 360 entries. Contrast is enforced by a test, and every screen is captured in Arabic and English, light and dark, at 390 and 1280 pixels. The Phase 14 gate report recorded 3,795 unit tests and 1,120 end-to-end tests passing, and the Phase 13 gate recorded Lighthouse accessibility 100 on the four main screens, with performance between 87 and 94. The screenshots here use synthetic data.
The hard part. Plain-language explanations usually mean sending raw data to a model. Nabd only ever sends computed summaries, never rows: a privacy guard is the last check before any request leaves the machine, a "Show what is sent" control displays the exact payload, and a monthly token budget caps spend. The analytics also refuse to present a correlation as a cause, which shaped both the maths and the copy.
The approach. Four one-way layers run from ingestion to analytics to API to app. The analytics package is pure TypeScript with no I/O and is the only place a number is computed. Two ingestion paths, the WHOOP CSV export and the WHOOP API on a scheduled sync, write through one upsert. The app is Nuxt 4 on SQLite via libSQL and Drizzle, styled with Tailwind logical properties and self-hosted IBM Plex Sans Arabic.
The outcome. Nabd was built in phases, each closed by a written gate, with a decision log of more than 360 entries. Contrast is enforced by a test, and every screen is captured in Arabic and English, light and dark, at 390 and 1280 pixels. The Phase 14 gate report recorded 3,795 unit tests and 1,120 end-to-end tests passing, and the Phase 13 gate recorded Lighthouse accessibility 100 on the four main screens, with performance between 87 and 94. The screenshots here use synthetic data.
My Role
Sole Developer & Product Designer — defined the privacy model and the layered architecture, built the ingestion, analytics and Nuxt app, wrote the bilingual copy, and ran the phase gates that decided when each part was done.
- Nuxt 4
- Vue 3
- TypeScript
- SQLite (libSQL)
- Drizzle ORM
- Zod
- Pinia
- Tailwind CSS 4
- shadcn-vue
- Reka UI
- @nuxtjs/i18n
- Claude API
- PWA
- Vitest
- Playwright + axe